PreviewThis feature is in Preview.
Configure permissions
Before connecting to Astro Observe, configure the necessary permissions for your data platform.- Snowflake
- Databricks
For Snowflake connections, the Observe role must have access to both the All Snowflake integrations require that the Observe role has access to both
ACCOUNT_USAGE and INFORMATION_SCHEMA system tables. The service user must have a default warehouse configured to support discovery and ongoing data quality monitoring.1
Log into Snowflake
Log into Snowflake using a high-privilege role such as
ACCOUNTADMIN.2
Create a dedicated role for Observe
Create Observe role
3
Create a read-only service user
Create a service user that Observe will use.
Create Observe service user
4
Assign the role to the user
Grant role to user
5
Grant the role the privileges Observe requires.
Replace
YOUR_DB and other example names to match your Snowflake environment.Example privileges for ASTRO_OBSERVE_ROLE
These are example grants. Replace database, schema, and warehouse names with values appropriate for your account and security policies.
Setup key-pair authentication in Snowflake (recommended)
Astronomer recommends key-pair authentication for Snowflake service users. Generate an RSA key pair, then assign the public key to the Observe service user to enable secure authentication.1
Generate a password-protected private key and a public key
Run the following commands on a secure host to create an encrypted private key and a public key:
Generate RSA key pair (example)
2
Validate the key
3
Assign the public key to the Snowflake user
Remove the
-----BEGIN PUBLIC KEY----- and -----END PUBLIC KEY----- headers and newlines so the key is a compact single string. Assign the cleaned public key to the service user:Assign public key to Snowflake user
ACCOUNT_USAGE and INFORMATION_SCHEMA system tables. The service user must have a default warehouse configured for all discovery and monitoring operations.Set up a connection
After you configure permissions for your data platform, create an Observe connection.1
Open Connections
In the Astro UI main navigation, go to Dashboards > Data Quality and click + New Connection (in the legacy UI, navigate to Data Quality > Connections and click + Connection).
2
Fill in connection details
- Snowflake
- Databricks
Complete the following fields:
- Name: A name for the connection.
- Description: Optional description.
- Connection Type: Select Snowflake.
- Polling Schedule: How frequently Observe polls Snowflake for metrics (examples: every 1 hour, 6 hours, 1 day). Polling frequency is the maximum rate at which Observe updates data quality metrics and monitors; more frequent polling may increase Snowflake compute costs.
- Account Identifier: Your Snowflake account identifier (for example,
FY02423-GP2141). Observe maps assets to a connection by account identifier. - Username: The Snowflake service user (
ASTRO_OBSERVE_USER). - Private Key: Paste your private key for key-pair authentication if using key-pair auth.
Only one Observe connection is allowed per Snowflake account identifier. If you have multiple Snowflake accounts, create a separate connection for each account identifier.
3
Save and start discovery
Click Create. Observe begins the metadata extraction process and will discover your data assets and surface discovered tables in the Asset Catalog.
Navigating data quality in Astro Observe
Asset Catalog
Navigate to Catalog (Asset Catalog in the legacy UI), filter by your data platform (for example, Snowflake tables or Databricks tables), and select the desired table.You can sort tables by popularity to quickly identify frequently used tables. Popularity rankings are based on query frequency and the number of unique users accessing each table.
Schema
The Schema tab shows table structure details:- Column names
- Data types
- Completeness status
- Nullability
- Default values
Event Timeline
The Event Timeline tab shows data quality events for a selected timeframe. Events are color-coded by severity: Success, Neutral, and Failure. Click an event to view details, historical patterns, and affected metrics.Data quality
The data quality tab provides visualizations for monitored metrics:- Table Volume: track changes in row counts and percent change over time to identify unexpected fluctuations.
- Completeness: visualize column null percentages against thresholds to surface completeness problems.
Monitors
To create and manage data quality monitors, see Monitors in Astro Observe.Triggered monitor overview
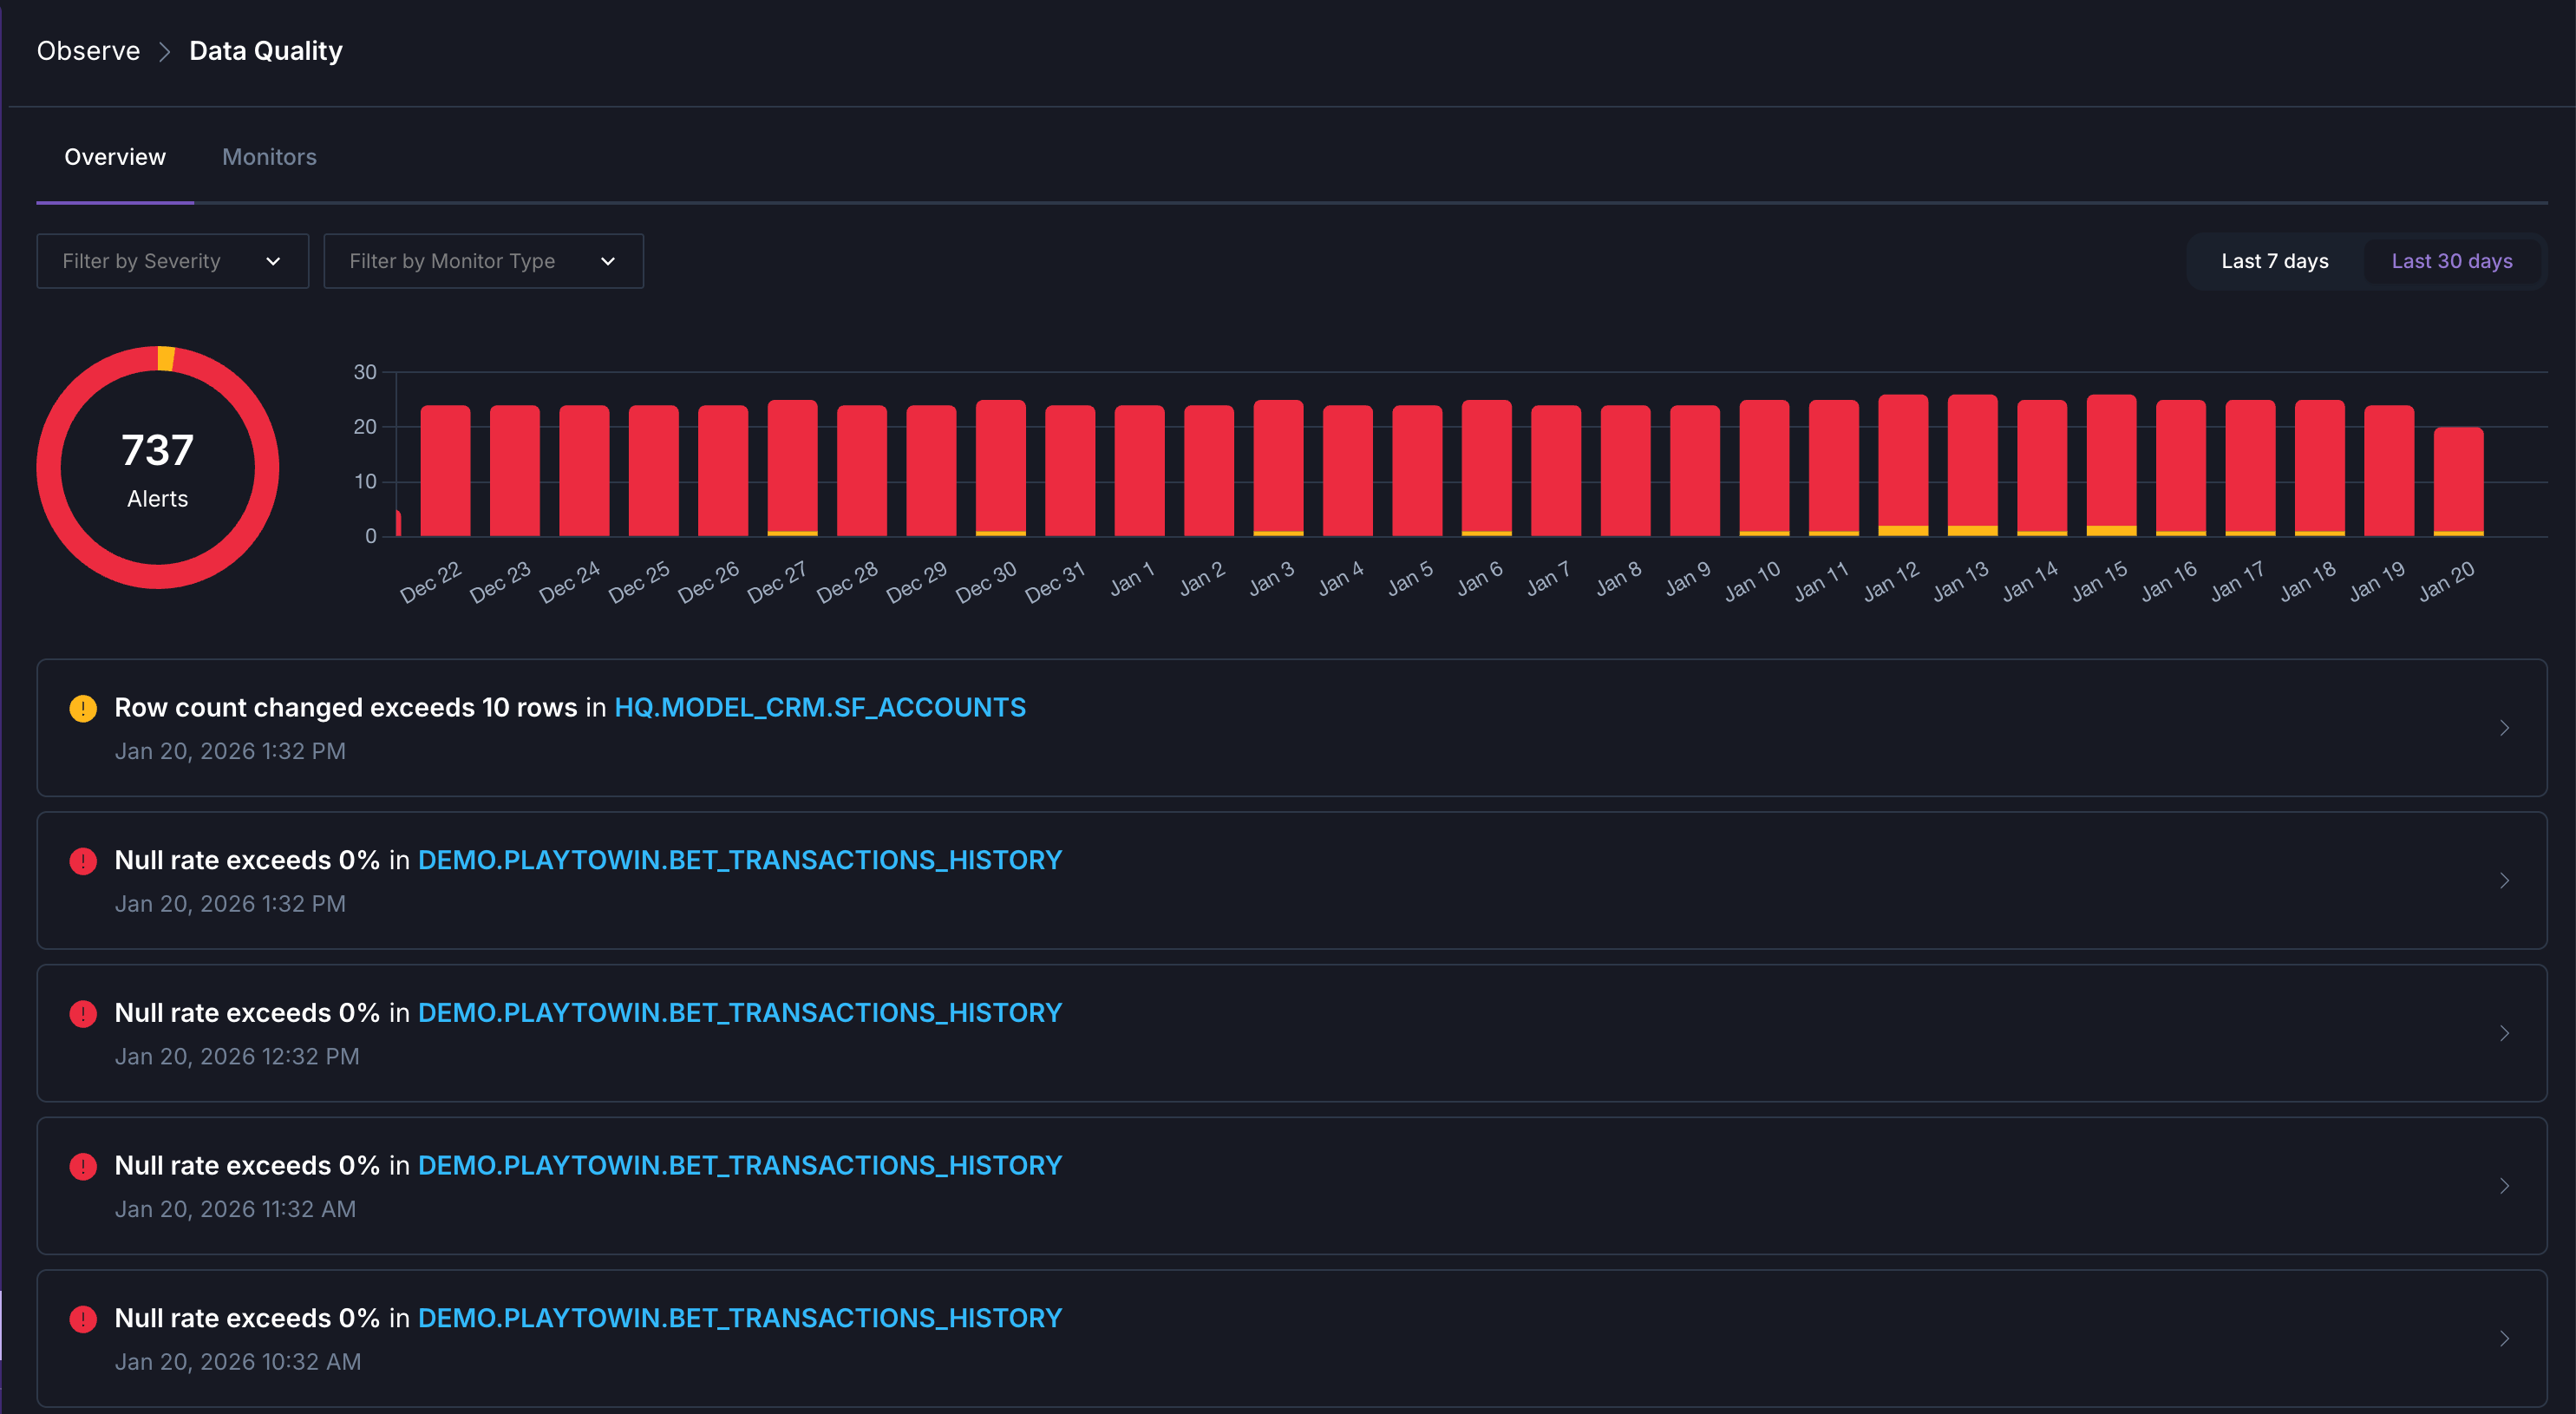
To see a high-level overview of your organization’s data quality, click Data Quality in the navigation. Here you can see a summary of triggered data quality monitors from the last week or month, grouped by severity and check type. Click any triggered monitor to investigate it and see the underlying data that triggered the monitor’s conditions.