Astro Observe overview
Astro Observe delivers pipeline-aware data observability purpose-built for Airflow, giving your team visibility into the health, quality, and performance of your business critical data products across the modern data stack. Using Observe, you can monitor business-critical pipelines as data products, track SLAs, troubleshoot pipeline- or data-level failures, and understand health across your data ecosystem.
Health
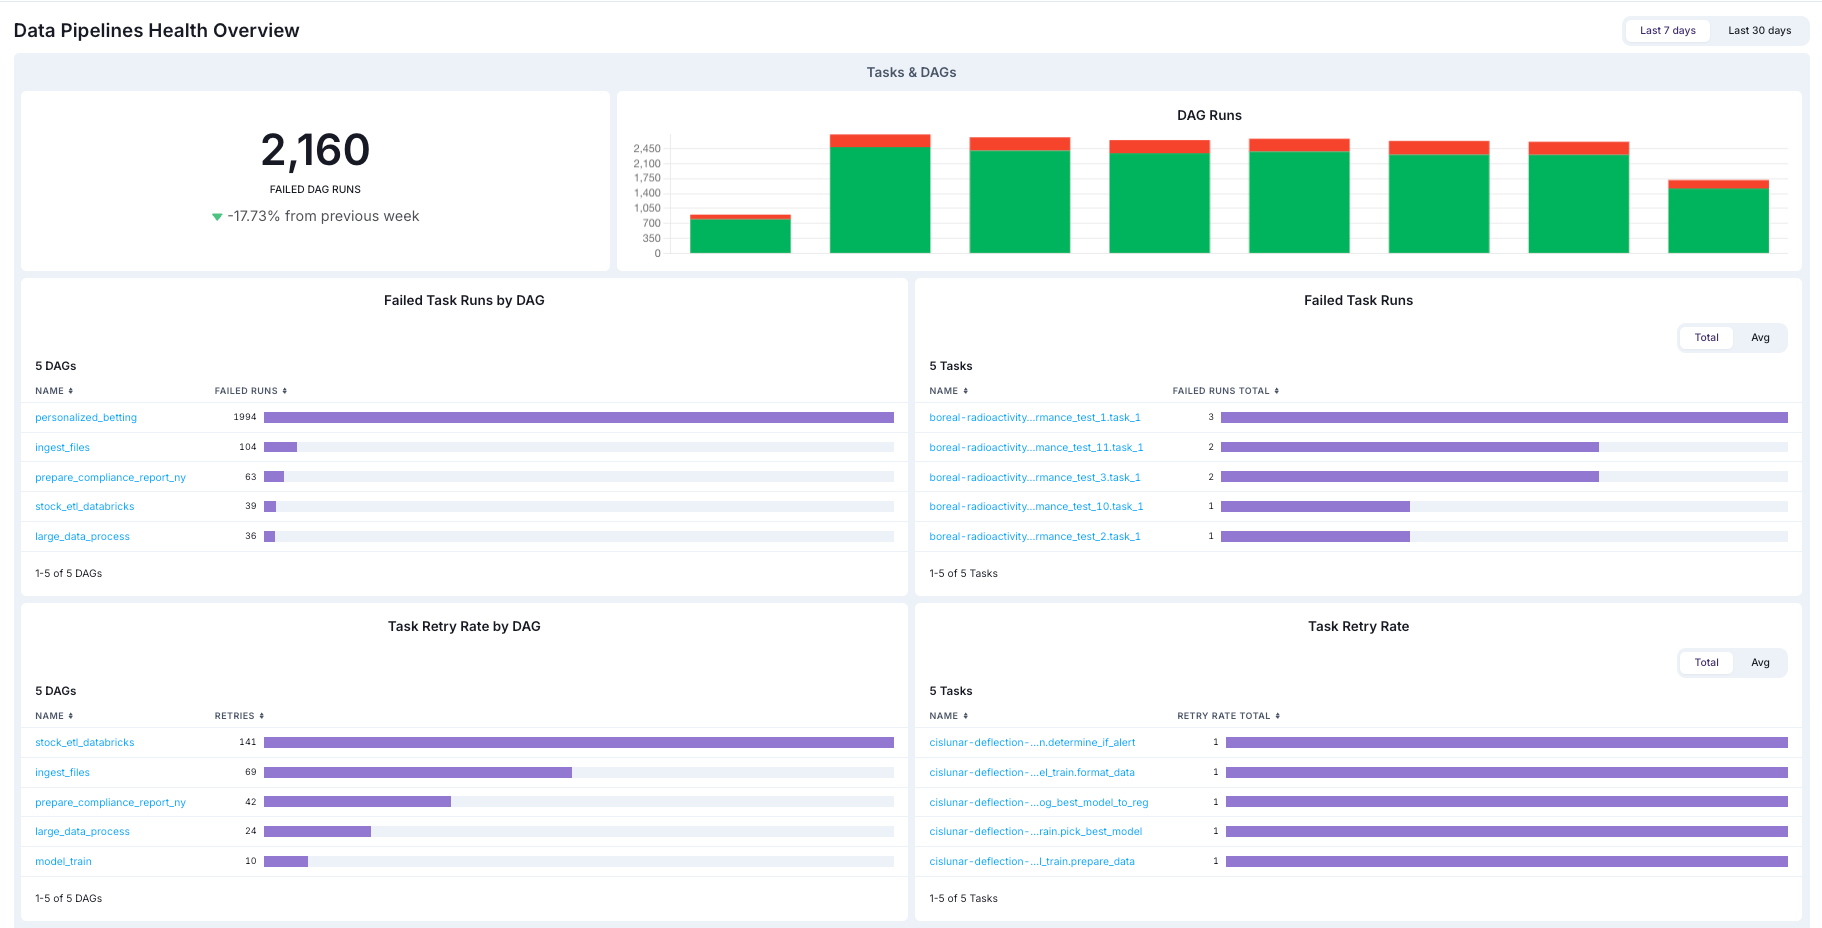
The Data Pipelines Health Overview shows a high-level view of operational and business health across your pipelines and data products. The dashboard includes pipeline-level run metrics, like failed runs and retries, to identify top silent failures and problematic jobs. The dashboard also shows reliability metrics across the platform, like SLA evaluations and triggered alerts, to help you identify issues at a glance and understand the overall health of your data ecosystem.
Data products
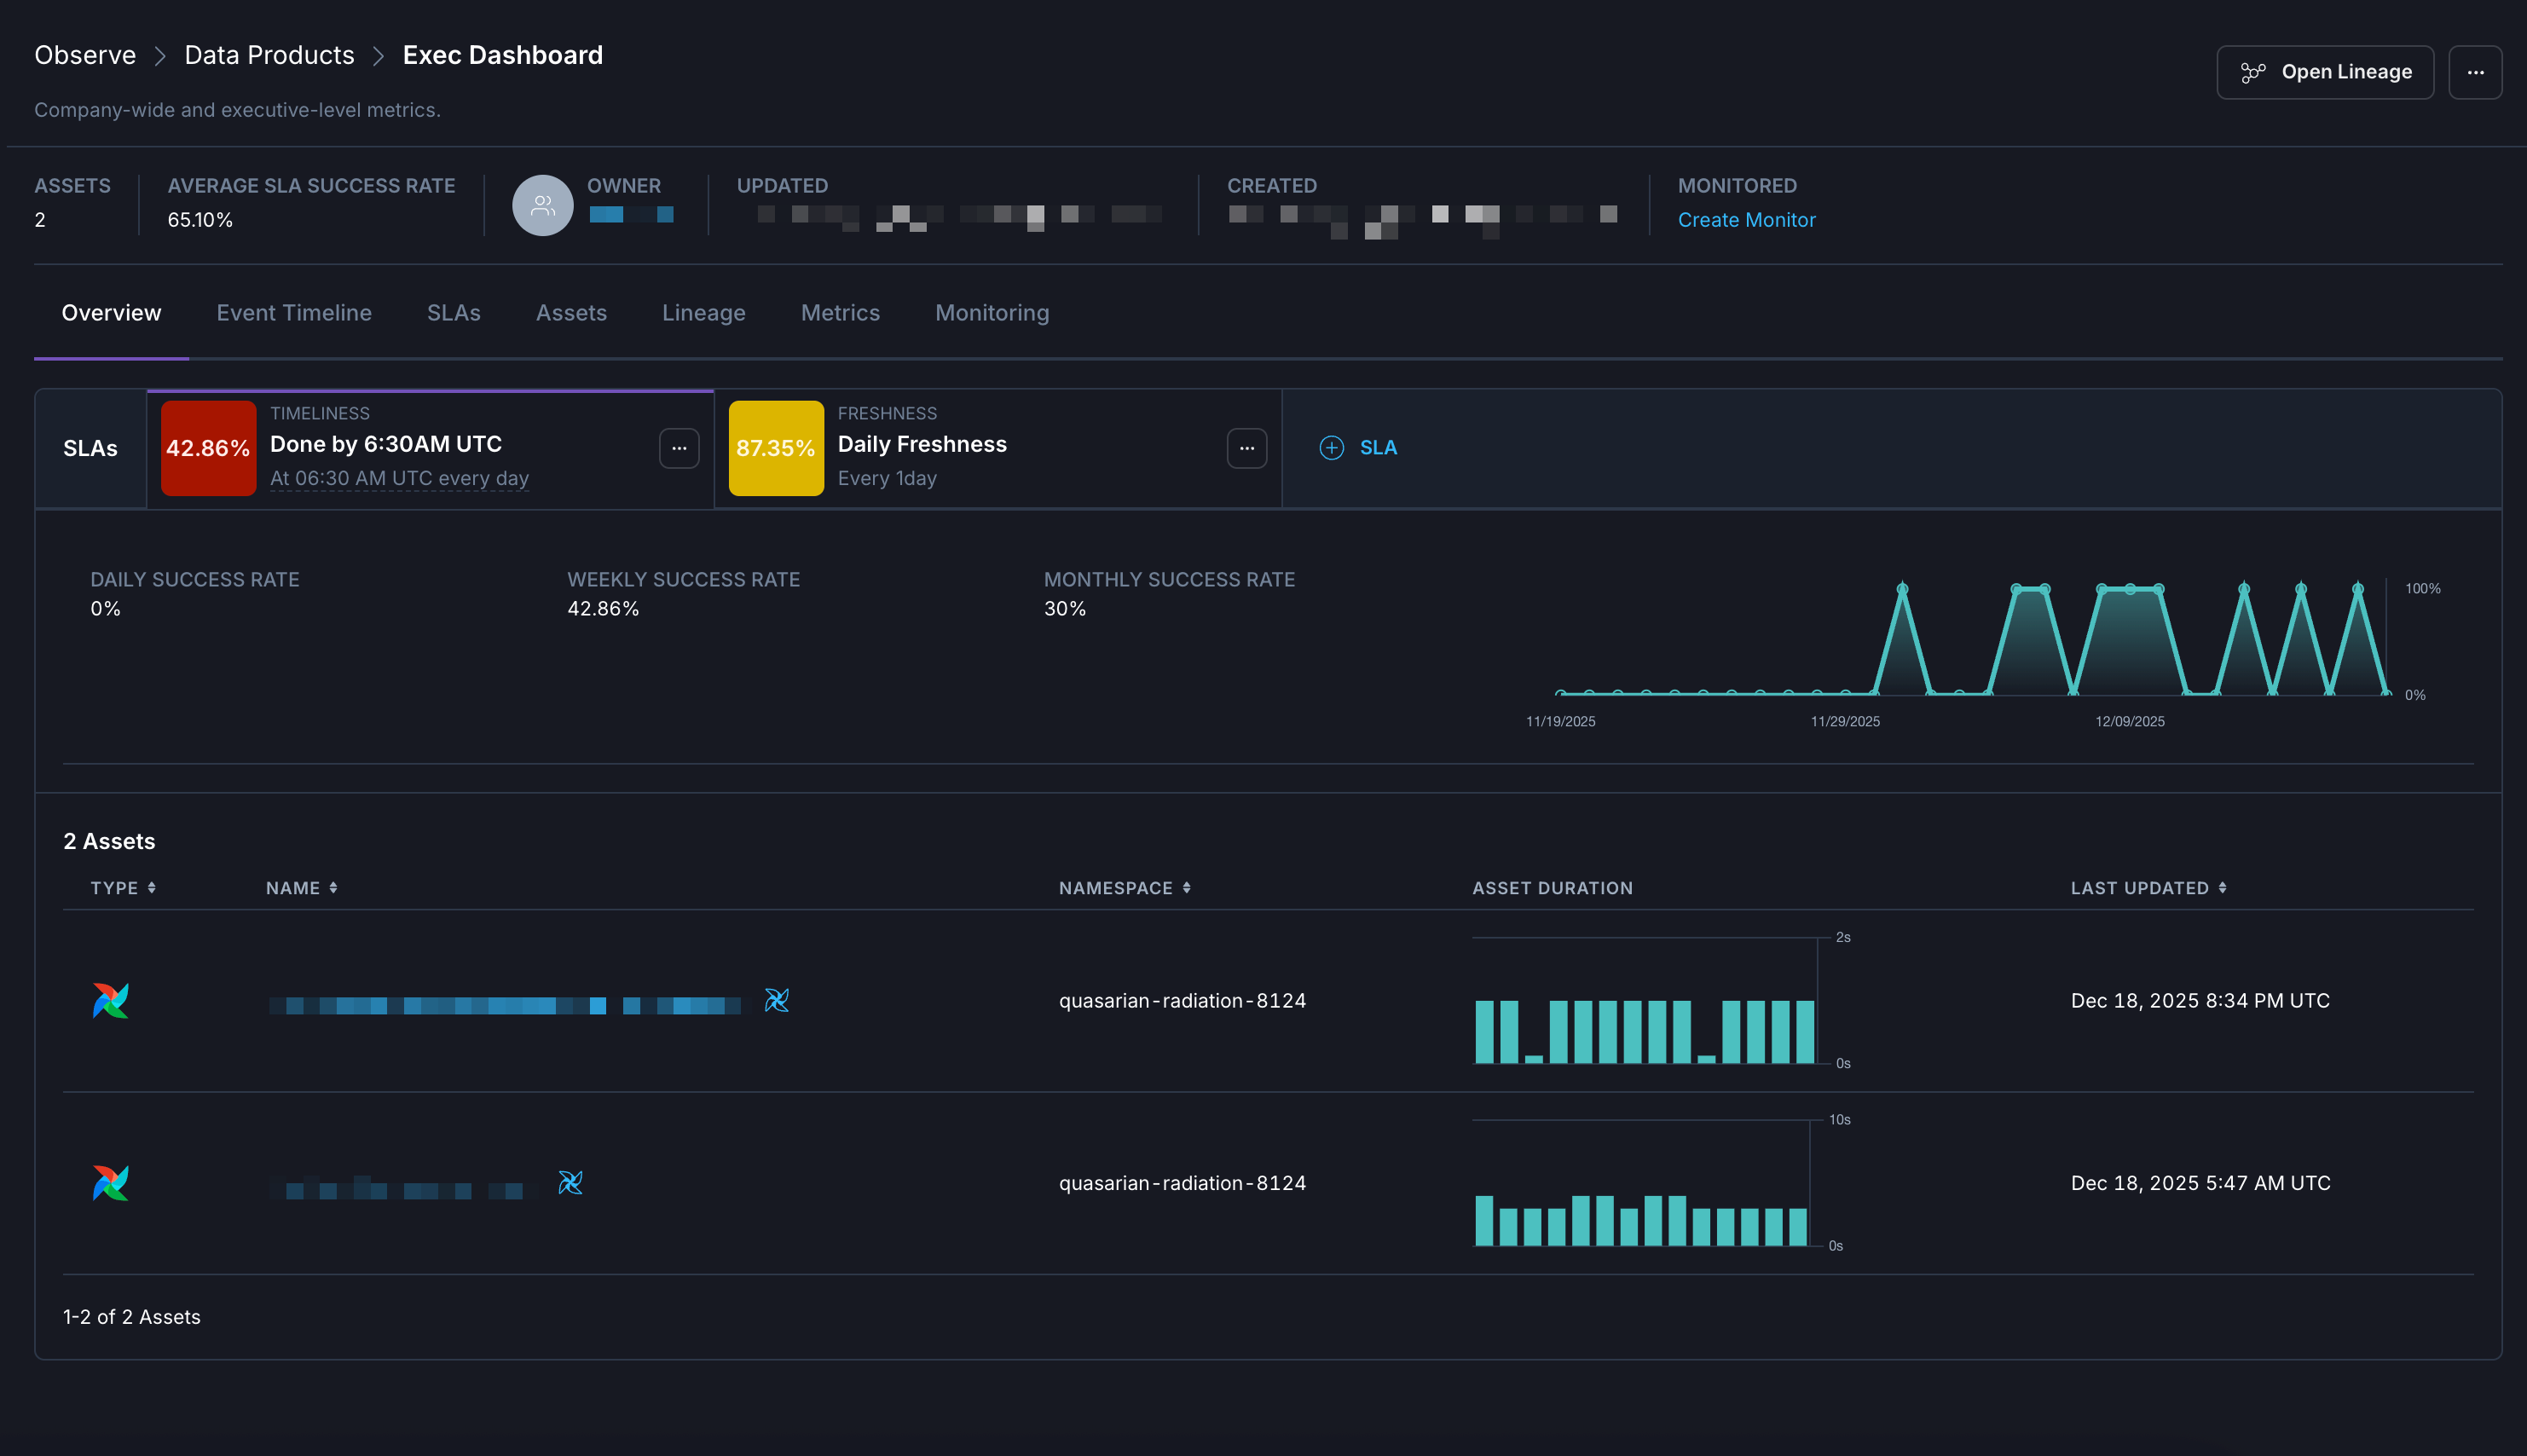
In Observe, a data product is a composition of assets that deliver a result with business relevance. Observe automatically infers upstream dependencies for the assets that define a data product, like an Airflow dag that populates a dashboard or a Snowflake table powering a recommendation engine. Data products in Observe can include data assets across Airflow deployments. For example, a set of five dags across different deployments that all populate an executive dashboard with product analytics can be grouped together into a single data product in Observe.
For guidance on identifying data products in your organization, see how to identify data products in your organization.
- Dependencies. A real-time lineage graph displays the relationships between the final assets in a data product and the upstream assets that feed into it.
- SLA evaluations. You can create custom business-level Service Level Agreements for evaluating the on-time delivery of a data product or its freshness. You can also view all SLAs in effect for the data product along with their current statuses at a glance.
- Metrics. You can see key metrics for assets across your data product, like task failures and retries.
See Create a Data Product to refer to steps to create your own data products. Or, to follow a quickstart, see Get started with Astro Observe.
Monitors
Preview
This feature is in Preview.Monitors in Astro Observe allow you to automatically track the health of your data products and pipelines. When configured, monitors can trigger alerts for failures or critical events in your data products, enabling rapid detection and resolution of issues.
See Monitors in Astro Observe for set-up instructions and details.
Asset Catalog
Assets include information about the attribute details and historical data regarding task runs. In the Astro UI, when you click Catalog (in the legacy UI, click Observe and then Asset Catalog in the Organization menu), you can view and filter the different data assets in your Workspace.
In this view you can see the following information about your Assets, including:
- Name
- Asset type
- Namespace
- Dag ID
- Owner
You can click on any asset to view more detailed information about it, such as historical metrics and metadata. To learn more about using assets and accessing metrics, see Assets overview.