

Setup
-
Open a browser and go to
kibana.BASEDOMAIN. - Click Menu in the upper left, click Stack Management, and then click Index Patterns.
-
In the Name field enter
fluentd.*or entervector.*if using sidecar logging, and then click Create index pattern. Elasticsearch uses index patterns to organize how you explore data. Settingfluentd.*, orvector.*if using sidecar logging, as the index means that Kibana displays all logs from all deployments. -
Enter
@timestampas theTime Filter.
Discover
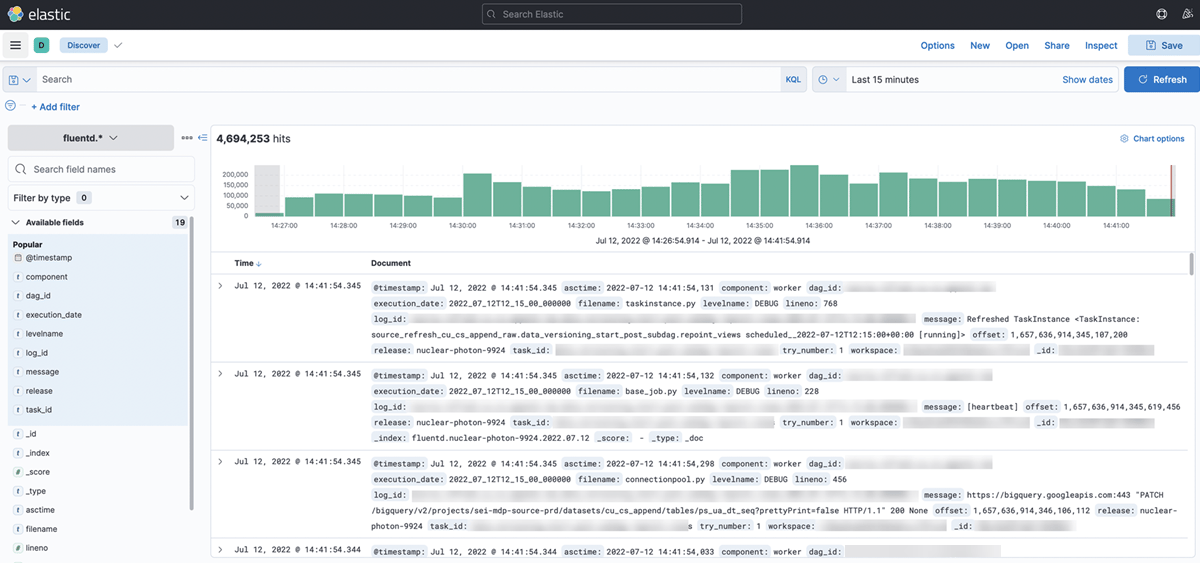
After the index pattern is confirmed, theDiscover tab displays logs as they become available.
Dashboards
Custom dashboards can be created in theDashboard view.