It Pays to be Picky: Leveraging Key Insights with Airflow and Astro
11 min read |
TLDR: don’t clean your plate.
When setting up an observability solution using Airflow, it pays to be picky.
The state of modern observability tooling is such that you can easily end up with more noise than signal in your environment, drowning out actionable insights into your most critical data assets.
Figuring out where to devote resources can be hard, however. You’ve got to decide what exactly you want and why. Identifying the insights with the most value to your team is half the battle.
Here are four key observability insights to consider focusing on when setting up an observability solution. Let’s call them the four food groups of observability:
Data freshness
This observability metric refers to how current the values in a dataset are. The better observability tools let you set the criteria used to determine freshness. An example use case for freshness checking is an internal dashboard. Data teams are often responsible for maintaining dashboards that stakeholders across an organization rely on for decision-making. Teams can’t know in advance when such an asset will be consumed, so freshness is likely to be the key quality metric in this case.
On-time delivery
On-time delivery, or timeliness, refers to how recently an asset was updated. As with freshness, you should be able to set the criteria used to check for on-time status. An example use case for on-time checking is a monthly report. Commonly, data teams are responsible for maintaining the datasets used to publish business-critical reports on a cadence. Such reporting often relies on data produced by multiple teams on different schedules, so on-time delivery, rather than freshness, is likely to be the key quality metric in this case.
Data dependencies tracking
Tracking of dependencies visualizes the flow of data from source to destination, capturing any transformations or processes applied along the way, along other metadata such as run duration and run status. For example, data lineage tracking can offer insight into who can access critical assets shared across an organization, unlocking data governance use cases such as PII tracking. Understanding how data moves and where it is accessed is useful for troubleshooting issues and auditing, as well as helping ensure data integrity in general.
Data quality
Don’t overlook traditional data quality monitoring. Time-tested checks for null, duplicate, and out-of-range values should be part of any observability solution. For example, schema changes, or changes to the structure of your data such as dropped columns, can indicate serious data quality issues. Data observability can provide insight into not only the nature of such a change but also the specific upstream task responsible for the change. Data lineage is helpful in such cases.
With Airflow and Astro, you can get exactly the insights you want into the health and performance of your pipelines.
Here, we’ll walk through your options for maximizing all four of these observability insights, including a new Astro product that enables you to do exactly this. It requires little setup and gives you control over the health and performance signals you care about. Yes, observability is critical, but you don’t need to clean your plate.
Introducing Astro Observe
OSS Airflow offers a number of observability features out of the box, but some require complex setup or have limitations. Dedicated observability tooling can be complicated to set up and manage, and existing OSS solutions can flood your channels with noise, without allowing fine-grained control over what you monitor or who has access to what.
On Astro, you have always been able to use all the data quality tools available in OSS Airflow. Now, you can also leverage an observability product called Astro Observe (public preview) that is part of the fully managed Astro platform. Observe offers control over the assets you monitor, the insights you receive, and who has access to what. You also get proactive alerting and recommendations, so it’s not only easy to take action on insights, but it’s also possible to address issues before they cause problems.
Features of Observe include:
- Data Products for selecting and combining assets across deployments for monitoring, with the ability to assign ownership
- SLAs (Service Level Agreements) for on-time delivery and freshness monitoring with proactive alerting and a recommendation engine
- A Data Product dashboard displaying performance stats with visualizations, lineage, assets, SLAs, alerts, and details
- Enriched Data Lineage visualizing upstream and downstream dependencies in all assets in the Data Product with run status and runtime information on task nodes, plus a detail drawer providing warnings, recommendations, and a link to Airflow for debugging
- A filterable Assets Tab with metadata including runtime and run status.
Note: Astro Observe is in active development, so more features are on the way.
A key difference between Astro Observe and other observability tools is that Observe uses Data Products to allow users to create customized, focused views of the metadata emitted by Airflow. This enables Astro Observe to monitor SLAs comprehensively across workflows, rather than individually per DAG. On Astro Observe, the metadata is delivered using OpenLineage, the standard open framework for data lineage. Instead of managing an OpenLineage metastore yourself and sifting through lineage events from every Airflow pipeline in your instance (in a tool such as Marquez), you can select specific assets for monitoring. You can also group assets together from across deployments. Plus, you don’t have to migrate to Astro to take advantage of Astro Observe. You can use Astro Observe even if you’re self-hosting open-source Airflow or using a managed service other than Astro.
Here’s a screenshot of a Data Product dashboard in Astro Observe:
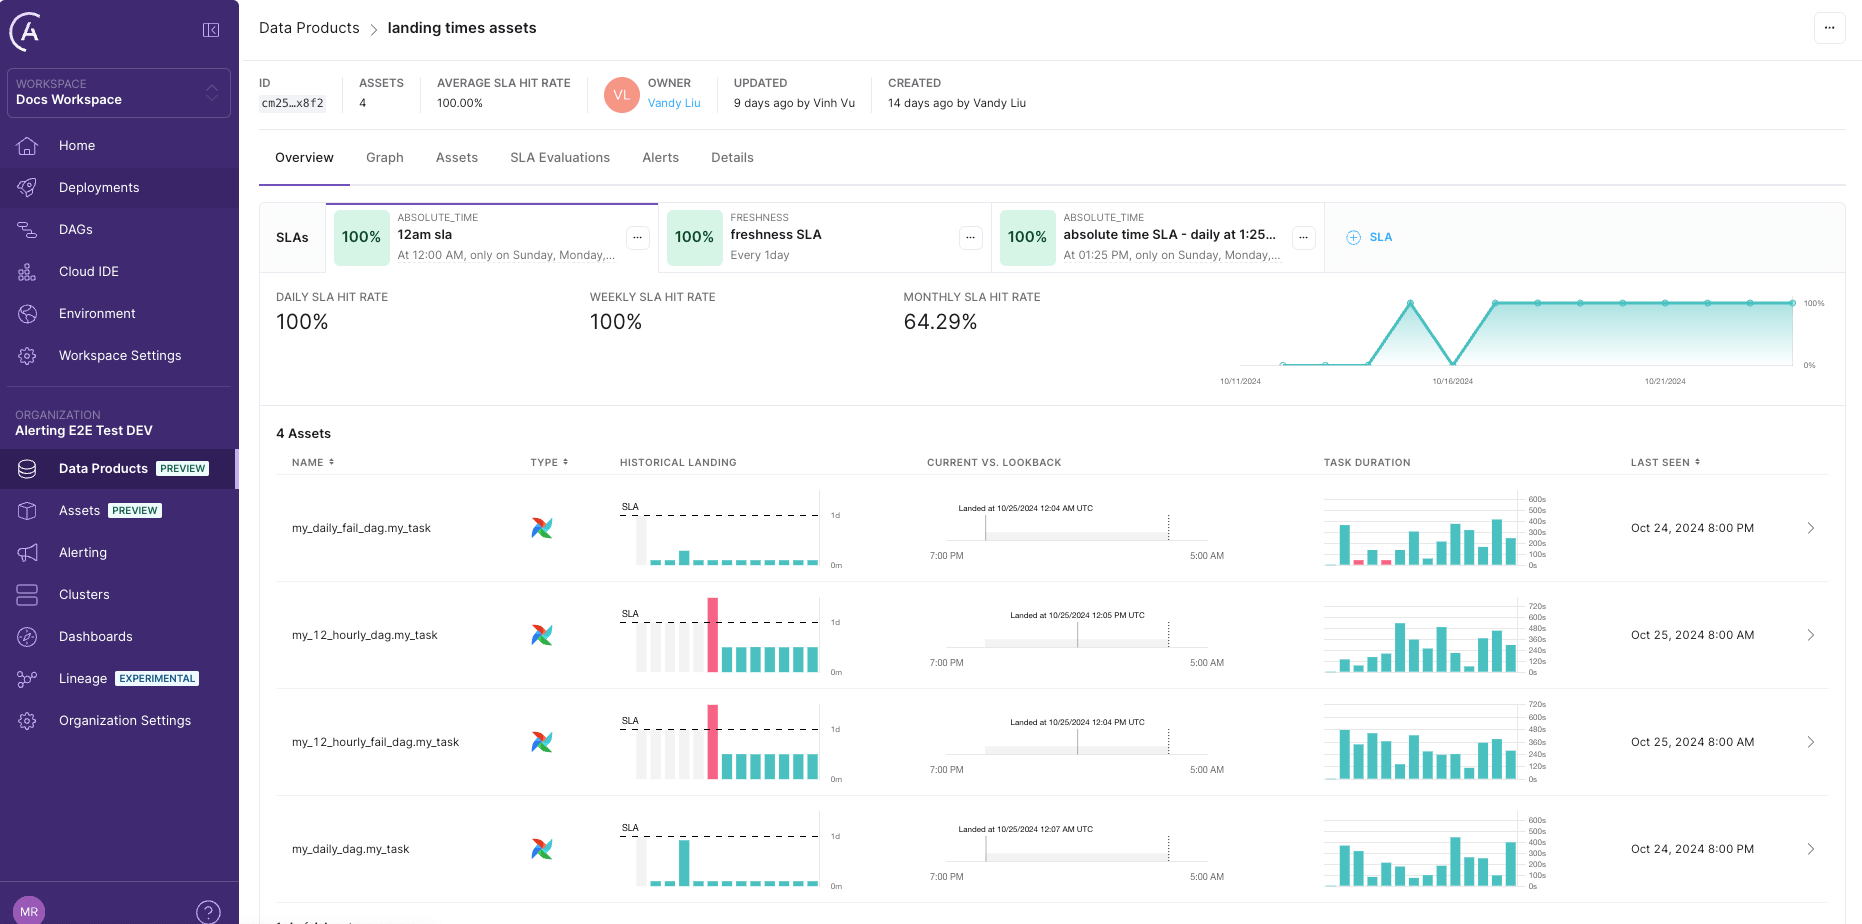
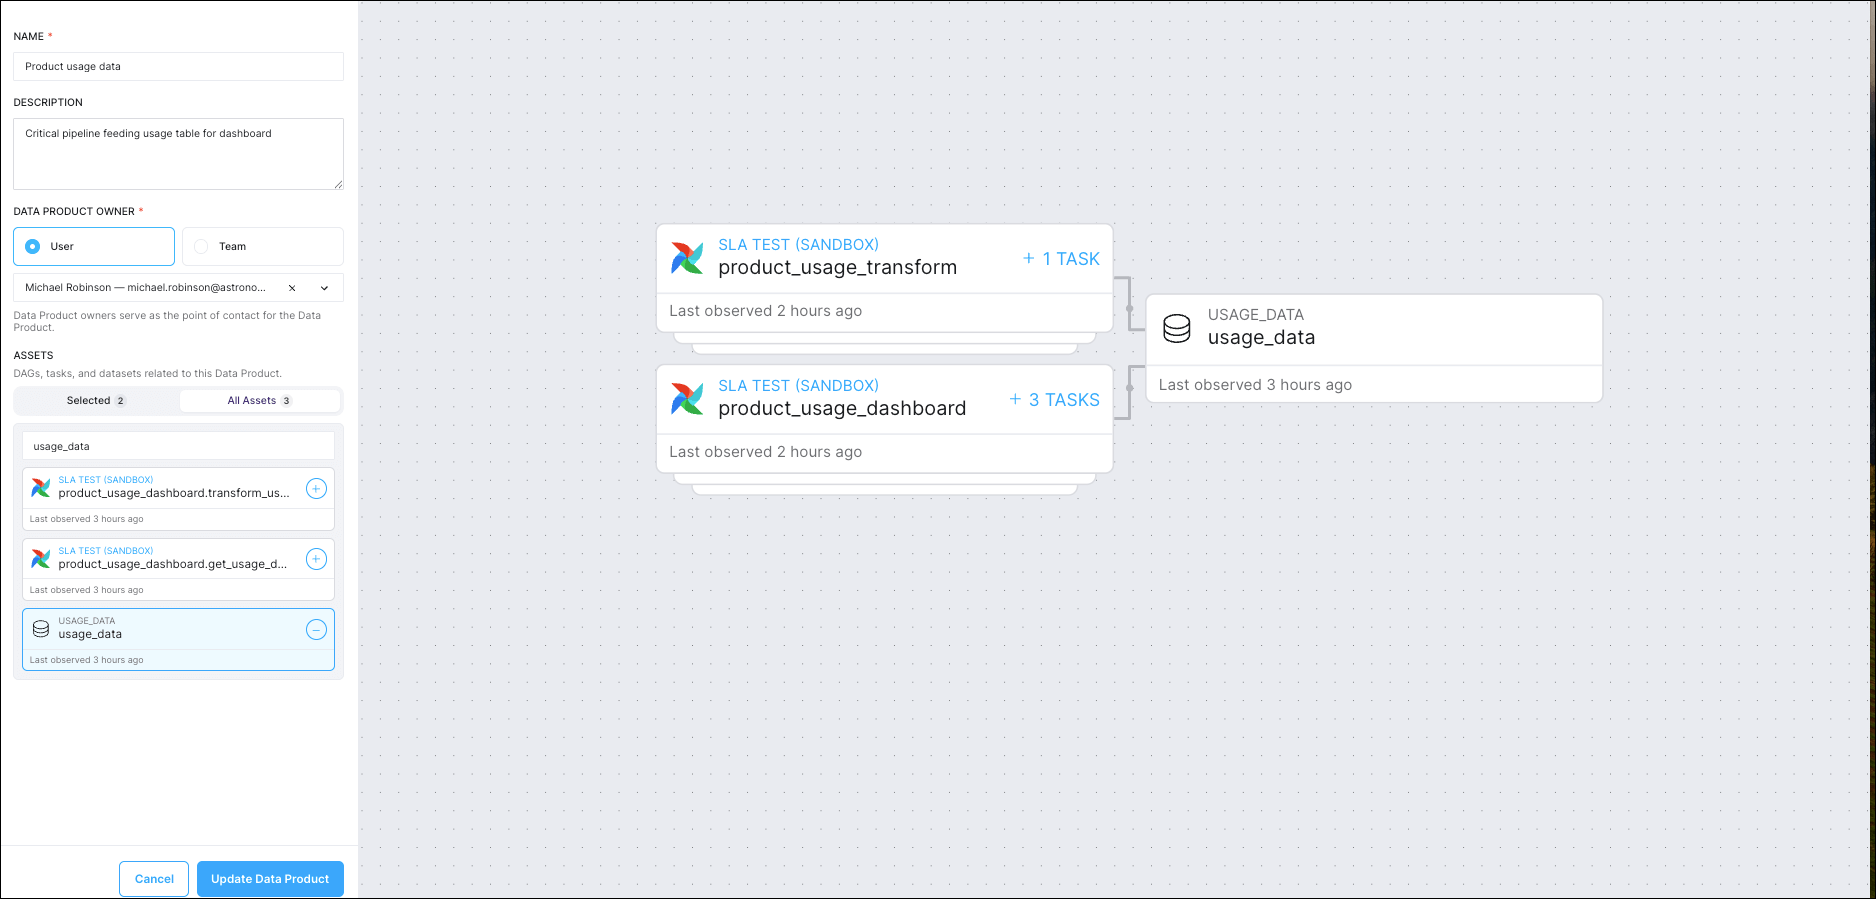
Astro Observe’s architecture offers this customization via an ingestion layer. The user can access an interactive interface for creating, updating, and deleting arbitrary collections of assets (tasks or Datasets) in their environment. This layer enables users to select specific assets for monitoring.
Here’s a screenshot of the interactive interface for updating a Data Product. By selecting the shared Airflow Dataset usage_data, the user has created a data product with two pipelines, product_usage_transform and product_usage_dashboard:
Data freshness and on-time delivery
Before - with OSS Airflow only
Airflow's built-in SLAs feature is designed to enable timeliness monitoring. Using an operator parameter, you can, in theory, set a maximum time duration in which a task should be completed relative to the dag Run start time. If a task takes longer than this to run, it should then be visible in SLA Misses in the UI. You can configure Airflow to send you an email of all tasks that missed their SLAs.
To set an SLA for a task, you pass a datetime.timedelta object to an operator's sla parameter. For more guidance, see: Airflow service-level agreements.
Note: the functionality of Airflow SLAs has known limitations, and removal of the feature is expected in a future release. Use with caution.
After - with Astro Observe + OSS Airflow
For reliable and easy-to-configure monitoring of a Data Product’s freshness or timeliness, you can set up SLAs in Astro Observe. You can use Freshness SLAs to track and enable alerting on how frequently you expect the asset to be updated. To do so, you specify a freshness policy of a number of minutes, hours, or days.
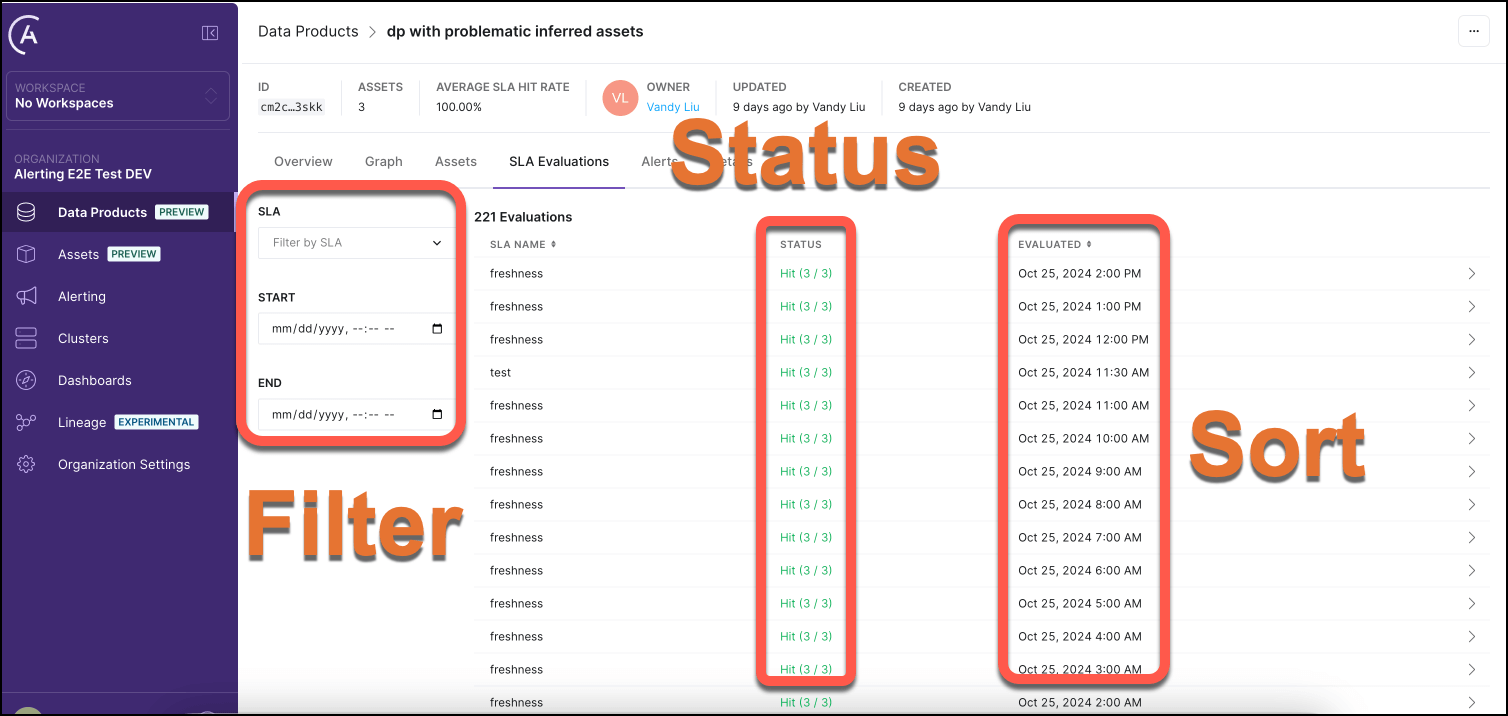
You can also set up Timeliness SLAs in Astro Observe to track and enable alerting on on-time delivery of data. To do so, you specify the days to evaluate the Data Product, the verification time, and the lookback period.
The Data Product landing page tracks all SLA evaluations on the SLA Evaluations tab:
Data dependencies tracking
Before - with OSS Airflow only
Open-source Airflow provides tracking of dependencies at the pipeline and task level, depending on whether you use Datasets in your pipelines.
Dag-level dependencies tracking using Datasets
If you use Airflow Datasets, you can find a graph of the upstream and downstream dag-level dependencies in your instance.
Here’s a Datasets graph example from the Airflow docs:
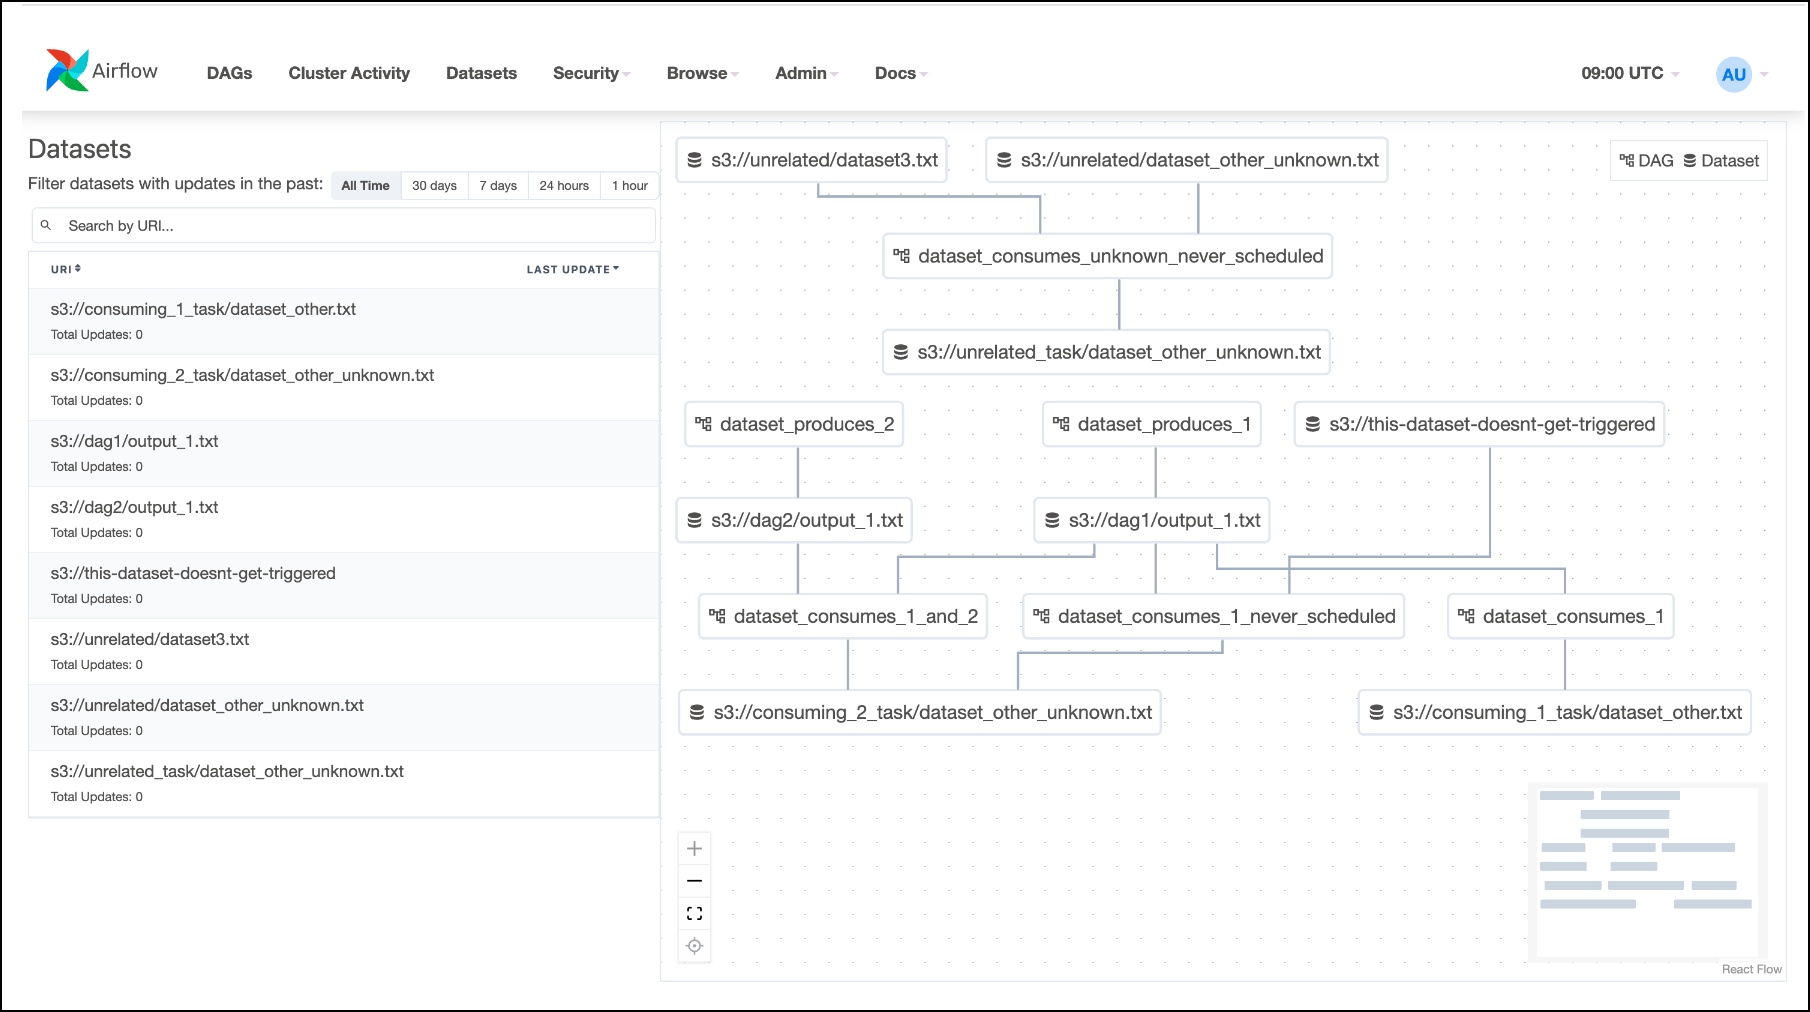
Clicking on any dataset in either the list or the graph will highlight it and its relationships. You can filter the list to show the recent history of task instances that have updated the dataset and whether it has triggered further dag runs.
You can use the graph to see at a glance the task instances that have updated a Dataset and the tasks that lie downstream and upstream of a Dataset in your pipelines. If you know which team owns which dag and which Datasets represent PII-containing tables, the graph can aid data governance use cases as well as help you debug your data-aware pipelines.
Task-level dependencies tracking on OSS Airflow
In the Airflow UI, the Graph tab displays a visualization of the tasks and dependencies in your dag, including Airflow Datasets. If you select a task or task group instance in a dag grid column, the graph highlights and zooms to the selected task. You can also navigate complex dags using the Filter Tasks option and the minimap. You can use this view to explore the dag structure and task dependencies, plus see a task’s run status at a glance:
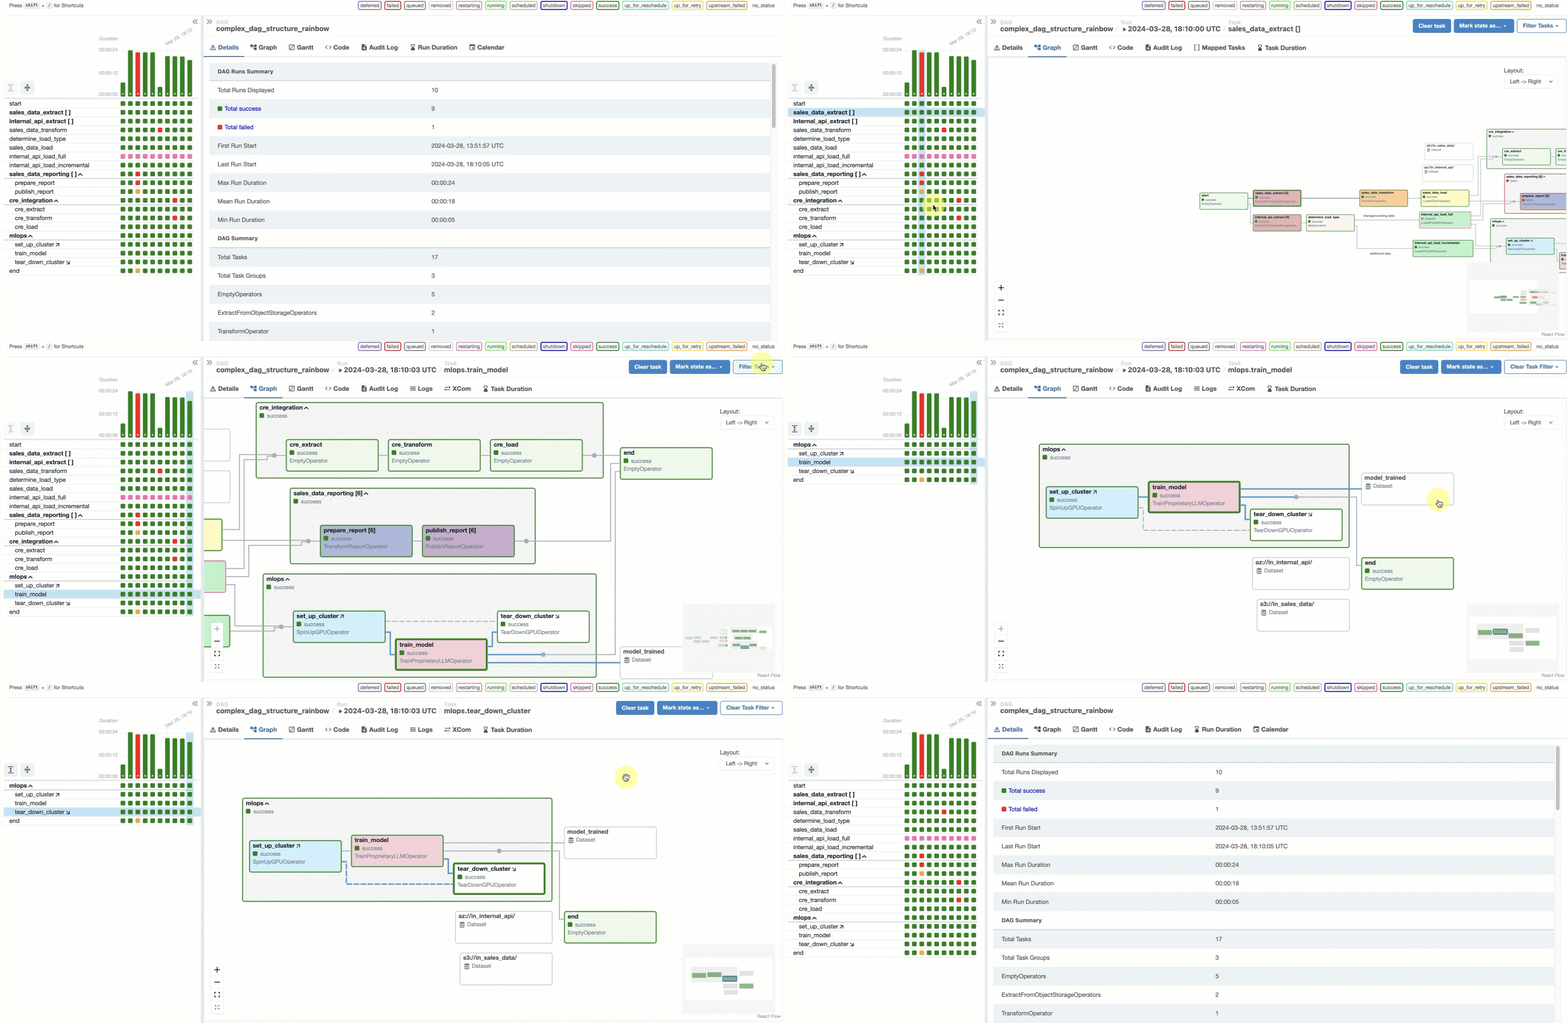
For a deep dive on this and other features of the Airflow UI, check out: Introduction to the Airflow UI.
After - Data Lineage Options with Astro Observe + OSS Airflow
Data lineage tracking using Data Products
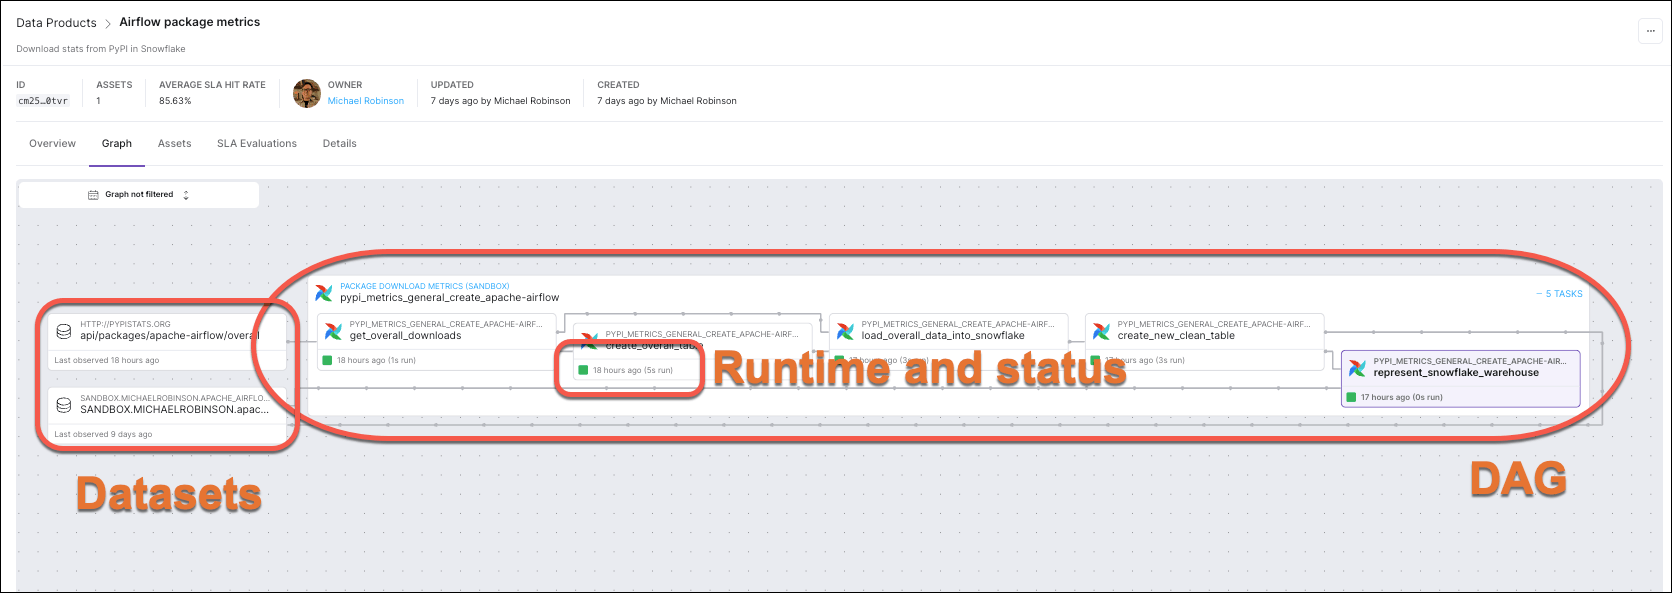
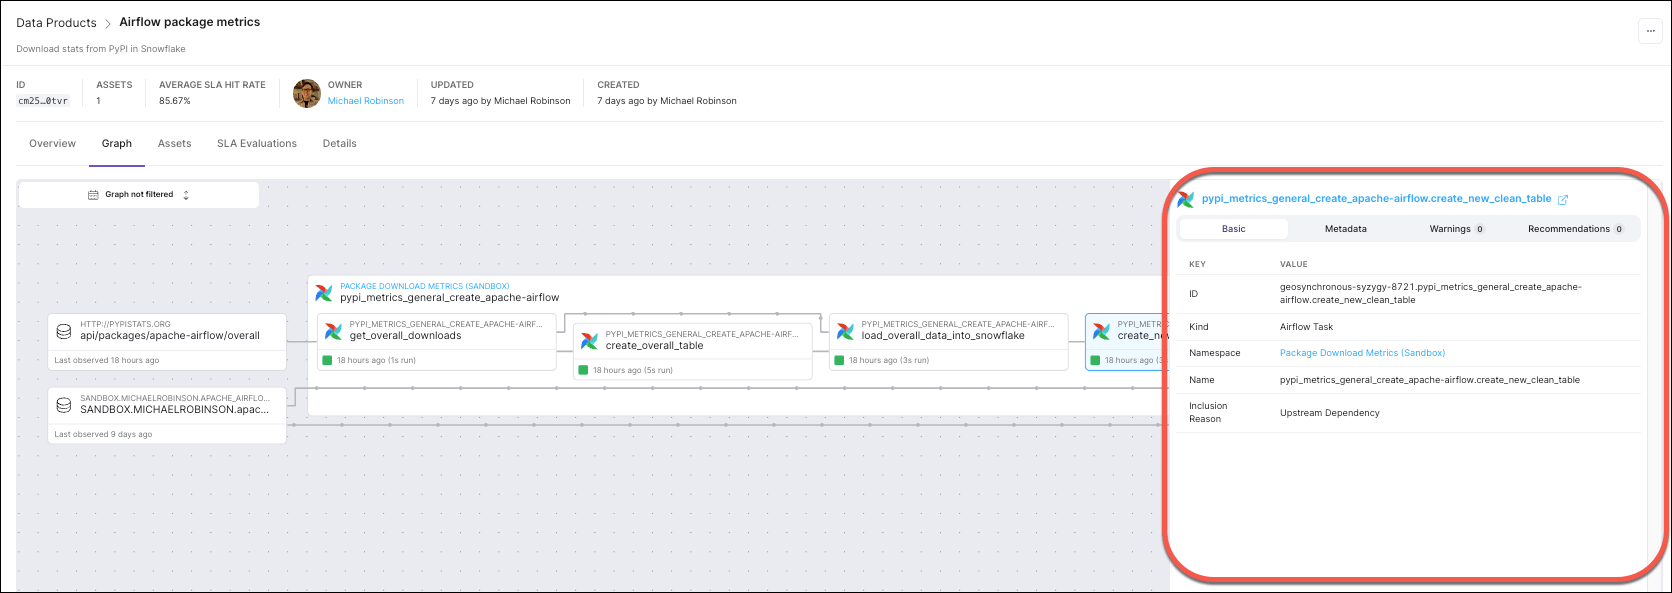
In Astro Observe, you can continue to debug dags using Airflow’s rich observability feature set, but you can also leverage these features across deployments from a single pane of glass. For example, the lineage graph in Astro Observe visualizes relationships across a data product, permitting the tracking of relationships between assets from across dags and deployments in an organization. If pipelines owned by different teams in your organization share a use case – such as feeding a critical dashboard – you can set up one dashboard and one set of alerts for monitoring the health and performance of the related pipelines. The lineage you get is also enriched, displaying runtime metadata on task nodes. Icons indicate whether an asset is an Airflow task or a Snowflake table (for example). A detail drawer offers additional metadata, warnings, recommendations, and a link to Airflow quick debugging.
The graph distinguishes between dags, tasks, and Datasets, and includes runtime and run status metadata on task nodes.
Clicking on an asset opens a drawer containing additional metadata, warnings, and recommendations:
Data quality
Quality & schema checking with Astro Observe + OSS Airflow
With OSS Airflow, you have a number of options when it comes to implementing data quality checks. You can use them to implement commonly used checks including schema validation. You can continue to use them without modification in Astro Observe.
Astronomer recommends using operators available from the Airflow SQL provider for most use cases, but Airflow also supports more specialized tools such as Great Expectations and Soda.
Operators commonly used for data quality checking include SQLColumnCheckOperator and SQLTableCheckOperator, both of which you can use to implement a number of different checks.
To use these operators in your pipelines, you need only supply a table and database connection to the operator and configure the checks via parameters.
Let’s say you have a generative AI pipeline that builds vector embeddings for text and performs a semantic search on the embeddings. You want to follow best practices and incorporate a data quality check on the embeddings table. Using OSS Airflow, you could add a schema check using SQLColumnCheckOperator to verify that the table contains the expected columns (in this case, text and vec):
col_check_embed = SQLColumnCheckOperator(
    task_id="col_check_embed",
    table=”embeddings_table”,
    column_mapping={
        "text": {
            "null_check": {
                "equal_to": 0
            },
        },
        "vec": {
            "null_check": {
                "equal_to": 0
            },
        },
    },
    conn_id="conn_id",
    )
The task will succeed with helpful log output if both are found:
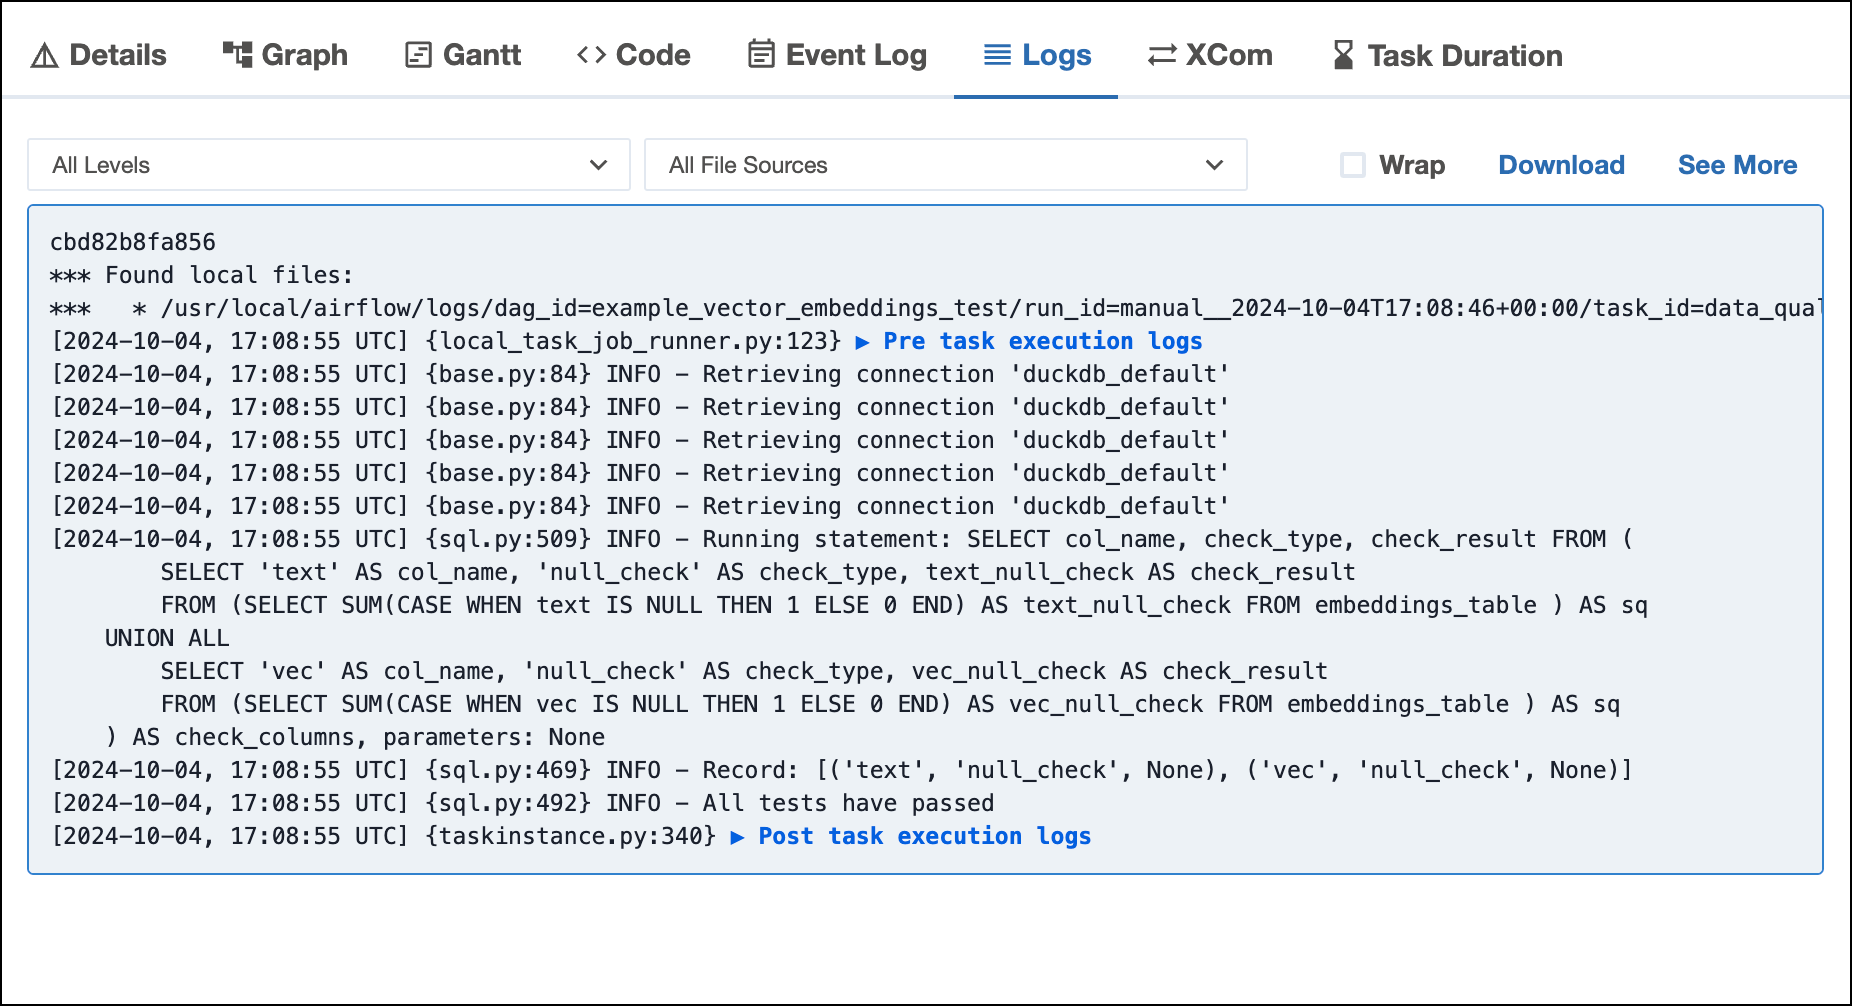
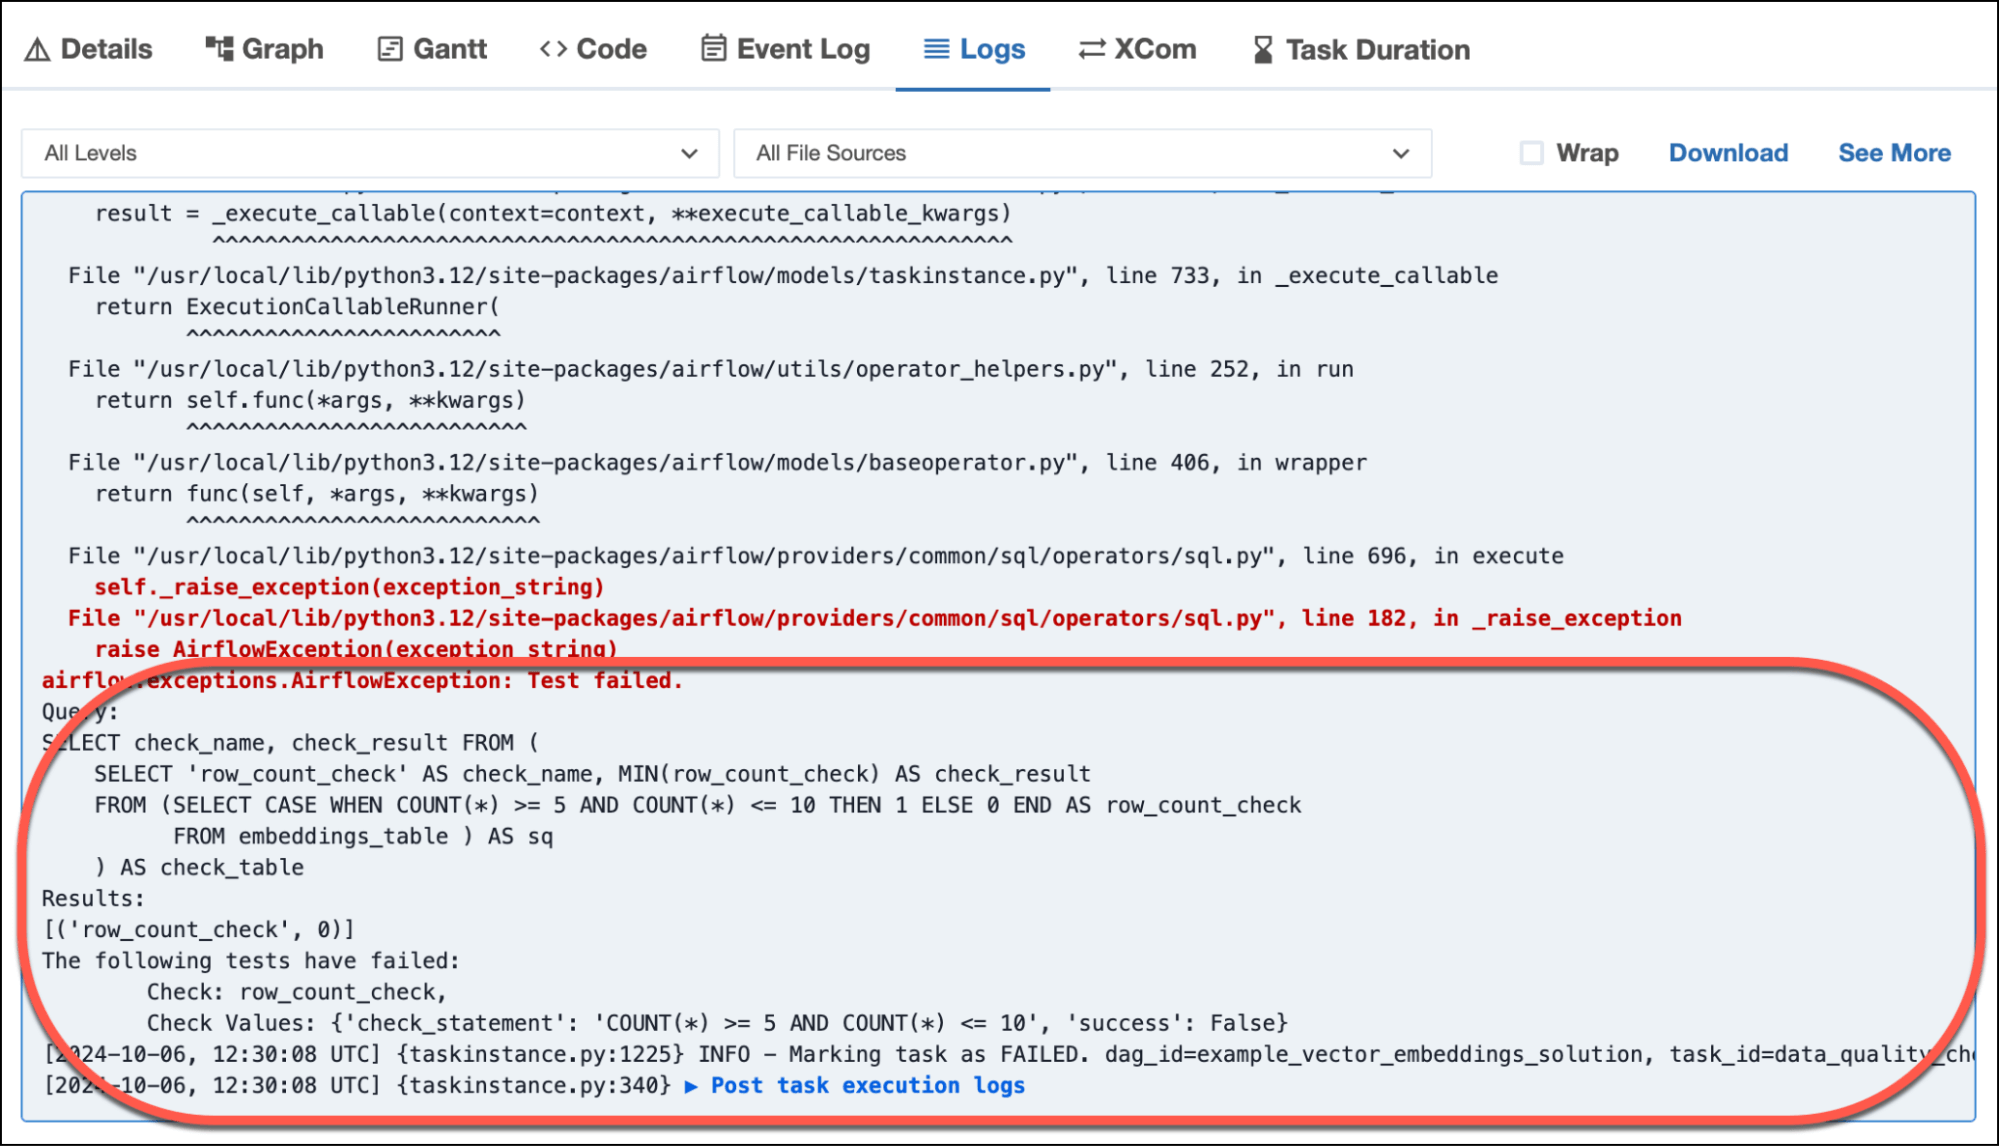
Let’s say you also want to add a row count, or data volume, check on the same table. You could use SQLTableCheckOperator to check the table for a specified number or range of rows:
row_check_embed = SQLTableCheckOperator(
    task_id="row_check_embed",
    table=”embeddings_table”,
    checks={
        "row_count_check": {"check_statement": "COUNT(*) >= 5 AND COUNT(*) <= 10"},
    },
   conn_id="conn_id",
)
The task will fail with helpful log output if the number of rows found does not match the condition you passed to the operator:
For more details about implementing data quality checks with Astro Observe and OSS Airflow, see: Data quality with Airflow.
Getting started on Astro Observe
Astro Observe lets you be picky and get proactive, tailored insights into your workflows. You can easily set up actionable monitoring of the “food groups” you care about.
Astro Observe is now in Public Preview and available to all customers. General availability is planned for early 2025.
If you’re interested in participating in the preview, you can sign up now, and we’ll be in touch to discuss your specific deployments and configuration.

Get started free.
OR
By proceeding you agree to our Privacy Policy, our Website Terms and to receive emails from Astronomer.